[DAY 9] Pandas 2
Group by - Basic

- SQL grroupby 명령어와 같음
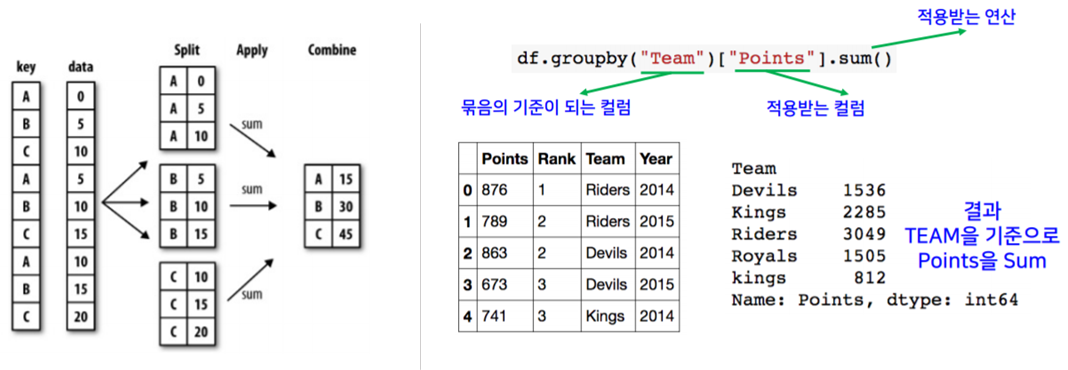
- split ➡ apply ➡ combine
- 과정을 거쳐서 연산함
- pivot table
한 개이상의 column을 묶을 수 있음
df.groupby(기준이 되는 팀)[적용받는 컬럼].(적용받는 연산)df.groupby("Team")["Points"].sum()
1
2
3
4
5
6
7
8
9
10
11
12
13
14
15
16
17
18
19
20
21
22
23
24
25
26
27
28
29
30
31
32
33
34
35
36
37
38
39
40
41
42
43
44
45
46
47
48
import pandas as pd

# data from:
ipl_data = {
    "Team": [
        "Riders",
        "Riders",
        "Devils",
        "Devils",
        "Kings",
        "kings",
        "Kings",
        "Kings",
        "Riders",
        "Royals",
        "Royals",
        "Riders",
    ],
    "Rank": [1, 2, 2, 3, 3, 4, 1, 1, 2, 4, 1, 2],
    "Year": [2014, 2015, 2014, 2015, 2014, 2015, 2016, 2017, 2016, 2014, 2015, 2017],
    "Points": [876, 789, 863, 673, 741, 812, 756, 788, 694, 701, 804, 690],
}

# groupby - 하나의 인자
df = pd.DataFrame(ipl_data)
df.groupby("Team")["Points"].std()

# groupby - 여러 인자
h_index = df.groupby(["Team", "Year"])["Points"].sum()
h_index
"""
팀별로 묶기
두개의 컬럼 이상으로 묶는다면, 계층적인 인덱스 구조라고 함
Team    Year
Devils  2014    863
        2015    673
Kings   2014    741
        2016    756
        2017    788
Riders  2014    876
        2015    789
        2016    694
        2017    690
Royals  2014    701
        2015    804
kings   2015    812
Name: Points, dtype: int64
"""
Hierarchical Index
- Groupby 명령의 결과물도 결국은 dataframe
- 두 개의 column으로 groupby를 할 경우, index가 두개 생성
unstack(): Group으로 묶여진 데이터를 matrix 형태로 전환해줌swaplevel(): Index level을 변경할 수 있음operations(): Index level을 기준으로 기본 연산 수행 가능
1
2
3
4
5
6
7
8
9
10
11
12
13
14
15
16
17
18
19
20
21
22
23
24
25
26
27
28
29
30
31
32
33
34
35
36
37
38
39
40
41
42
43
44
45
h_index.index
# MultiIndex([(), (), ...], names=['Team', 'Year'])

h_index["Devils":"Kings"] # "Devils"~"Kings" 까지의 데이터

h_index.unstack().stack().unstack()
"""
✔ unstack: Group으로 묶여진 데이터를 matrix 형태로 풀어줌
ex)
Year	2014	2015	2016	2017
Team
Devils	863.0	673.0	NaN	NaN
Kings	741.0	NaN	756.0	788.0
Riders	876.0	789.0	694.0	690.0
Royals	701.0	804.0	NaN	NaN
kings	NaN	812.0	NaN	NaN

✔ stack: 데이터를 다시 묶어줌
ex)
Year  Team
2014  Devils    863
2015  Devils    673
2014  Kings     741
2016  Kings     756
2017  Kings     788
2014  Riders    876
2015  Riders    789
2016  Riders    694
2017  Riders    690
2014  Royals    701
2015  Royals    804
      kings     812
Name: Points, dtype: int64
"""

h_index.reset_index() # 앞의 인덱스를 없애준?
h_index.swaplevel() # 레벨을 바꿔줌 Year Team => Team Year 이렇게 분류
h_index.swaplevel().sort_index(level=0) # 레벨 0 인덱스 기준으로 인덱스를 sorting
h_index.swaplevel().sort_values() # values기준으로 인덱스를 sorting

type(h_index) # Series data (컬럼이 두개이지만 df 아니로 series!)

# multi index 일때는 level만 지정해주면, 특정 level에만 접근하여 연산 가능
h_index.std(level=0)
h_index.sum(level=1)
grouped()
grouped- Groupby에 의해 Split된 상태를 추출 가능함
- 특정 key값을 가진 그룹의 정보만 추출 가능
- 추출된 group 정보에는 세 가지 유형의
apply가 가능함 - Aggregation: 요약된 통계정보를 추출해 줌 (
sum, min) - Transformation: 해당 정보를 변환해줌 (lambda filter, 데이터 변환)
- Filtration: 특정 정보를 제거 하여 보여주는 필터링 기능(제거, 검색, 필터링)
- aggregation:
agg()- 특정 컬럼에 여러개의 function을 Apply 할 수 도 있음
- transformation:
transform()- Aggregation과 달리 key값 별로 요약된 정보가 아님
- 개별 데이터의 변환을 지원함
- 단 max나 min 처럼 Series 데이터에 적용되는 데이터 들은 Key값을 기준으로 Grouped 된 데이터 기준
filter()- 특정 조건으로 데이터를 검색할 때 사용
- filter안에는 boolean 조건이 존재해야함
- len(x)는 grouped된 dataframe 개수
1
2
3
4
5
6
7
8
9
10
11
12
13
14
15
16
17
18
19
20
21
22
23
24
25
26
27
28
29
30
31
32
33
34
35
36
37
38
39
40
41
42
43
44
45
46
47
48
49
50
# 그룹별로 나눠진 split 상태(1단계)에서의 값을 가져올 수 있음
# = grouped 상태
grouped = df.groupby("Team") # 기준 column으로 데이터 나눔
# grouped: generator 상태
# list(grouped)

# for key, value in df
# key, value 상태로 뽑을 수 있는 상태 = grouped 상태
# Tuple 형태로 그룹의 key 값, Value값이 추출됨
for name, group in grouped:
    print(name)
    print(group)

grouped.get_group("Devils")
# 특정 그룹에 있는 상태를 가져옴
# 특정 key값을 가진 그룹의 정보만 추출 가능

grouped.agg(max) # 컬럼에 적용

# grouped 된 상태에서 ✔ 컬럼별로 연산 진행 ✔
# 그룹별로 컬럼에 적용
# 특정 컬럼에 여러개의 function을 Apply 할 수 도 있음

import numpy as np
grouped.agg(np.mean)
# 컬럼에 적용시키되, 그룹별로 출력

df.describe()
grouped.describe().T

# Transformation ?????
# grouped 되어있는 상태에서 각 컬럼별로 동일한 연산 진행
# 단, max나 min 처럼 Series 데이터에 적용되는 데이터 들은 Key값을 기준으로 Grouped된 데이터 기준
# 각각의 값에 영향을 줄 수 있게 함
# 위의 operataion은 컬럼별로 연산해서 하나의 값으로 요약했다면, 얘는 요약하는게 아니라 하나의 데이터 자리에는 반드시 하나의 값이 들어가게 됨

# grouped는 이미 df.groupby() 연산을 거친 이후의 상태임
# 정규화
score = lambda x: (x - x.mean()) / x.std()
grouped.transform(score)

score = lambda x: (x - x.min()) / (x.max() - x.min())
grouped.transform(score)

df["Team"].valu_counts()
# filter
df.groupby("Team").filter(lambda x: len(x) >= 3)
df.groupby("Team").filter(lambda x: x["Points"].mean() > 700)
# "Team"별로 (묶어서) points의 mean이 700 초과인 것만 뽑아라!
df.groupby("Team").filter(lambda x: x["Points"].max() > 800)
Pivot table Crosstab
- Pivot Table
- 우리가 excel에서 보던 그 것!
- Index 축은 groupby와 동일함
- Column에 추가로 labeling 값을 추가하여,
- Value에 numeric type 값을 aggregation 하는 형태
- Crosstab
- 특허 두 칼럼에 교차 빈도, 비율, 덧셈 등을 구할 때 사용
- Pivot table의 특수한 형태
- User-Item Rating Matrix 등을 만들 때 사용가능함
- 두 데이터가 얼마나 관련이 있는지 알 수 있음
- groupby에 unstack을 사용하는 것보다 Pivot table, Crosstab을 사용하면 더 편히 사용 가능
- 컬럼에 labeling 값을 붙여서 aggregation 해주기

- index, value/col 지정
- aggfunc: 연산자 지정
- fill_value: NaN값을 어떤 값으로 대체시킬 것인지
Pivot Table
1
2
3
4
5
6
7
8
9
10
11
12
13
14
  df_phone = pd.read_csv("./data/phone_data.csv")
  df_phone["date"] = df_phone["date"].apply(dateutil.parser.parse, dayfirst=True)
  df_phone.head()

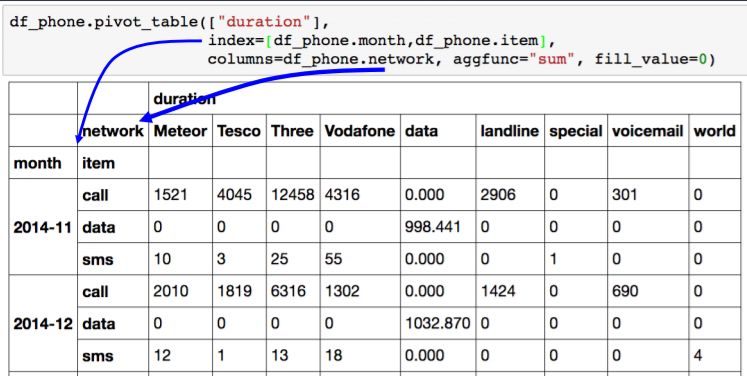
  df_phone.pivot_table(
      values=["duration"],
      index=[df_phone.month, df_phone.item],
      columns=df_phone.network,
      aggfunc="sum",
      fill_value=0,
  )

  df_phone.groupby(["month", "item", "network"])["duration"].sum().unstack()
  # 하면 뒤의 값과 비슷하게 나옴
Crosstab
1
2
3
4
5
6
7
8
9
10
11
12
13
14
15
16
17
18
19
20
  df_movie = pd.read_csv("data/movie_rating.csv")
  df_movie.head()

  df_movie.pivot_table(
      values=["rating"],
      index=df_movie.critic,
      columns=df_movie.title,
      aggfunc="sum",
      fill_value=0,
  )

  pd.crosstab(
      index=df_movie.critic,
      columns=df_movie.title,
      values=df_movie.rating,
      aggfunc="first",
  ).fillna(0)

  df_movie.groupby(["critic", "title"]).agg({"rating": "first"}).unstack()
  # 위의 값과 동일한 결과!
Merge & Concat

merge
- SQL에서 많이 사용하는 Merge와 같은 기능
- 두 개의 데이터를 하나로 합침(하나의 기준점을 통해)
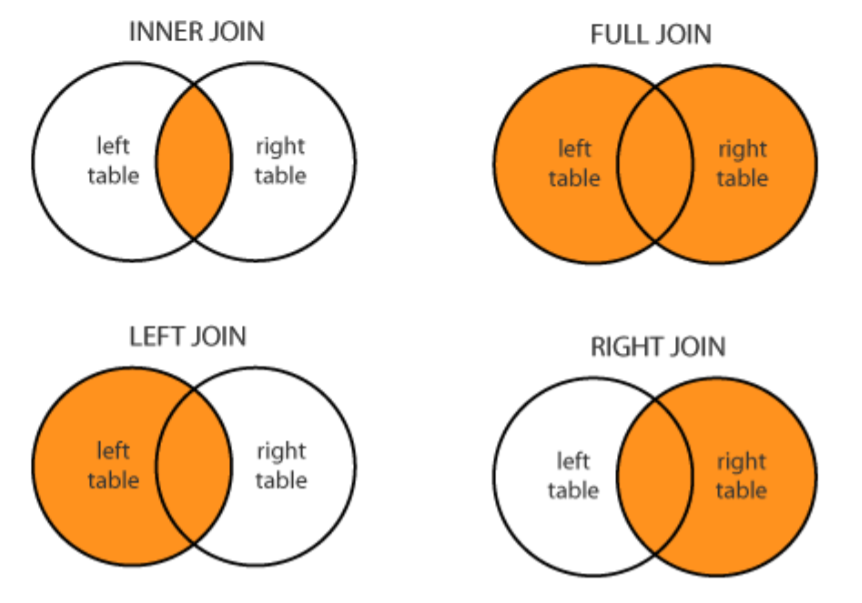
- 데이터를 어떻게 합칠것인가!
on인자: 기준인자 양쪽에 다 같은 컬럼이 있어야함- 둘의 프레임을 합칠 수 있음(같은 값이 있는 것들만!)
join method 라고 부름
1
2
3
4
5
6
7
8
9
10
11
12
13
14
15
16
17
18
19
20
21
22
23
24
25
26
27
28
29
30
31
32
33
34
35
36
37
38
39
40
41
42
43
44
45
46
47
48
49
50
51
52
53
54
55
56
57
58
59
60
61
62
63
64
65
66
67
68
69
import pandas as pd

raw_data = {
    "subject_id": ["1", "2", "3", "4", "5", "7", "8", "9", "10", "11"],
    "test_score": [51, 15, 15, 61, 16, 14, 15, 1, 61, 16],
}
df_a = pd.DataFrame(raw_data, columns=["subject_id", "test_score"])
"""
  subject_id	test_score
0	1	51
1	2	15
2	3	15
3	4	61
4	5	16
5	7	14
6	8	15
7	9	1
8	10	61
9	11	16
"""

raw_data = {
    "subject_id": ["4", "5", "6", "7", "8"],
    "first_name": ["Billy", "Brian", "Bran", "Bryce", "Betty"],
    "last_name": ["Bonder", "Black", "Balwner", "Brice", "Btisan"],
}
df_b = pd.DataFrame(raw_data, columns=["subject_id", "first_name", "last_name"])
"""
  subject_id	first_name	last_name
0	4	Billy	Bonder
1	5	Brian	Black
2	6	Bran	Balwner
3	7	Bryce	Brice
4	8	Betty	Btisan
"""
##########################################################################
pd.merge(df_a, df_b, on="subject_id")
"""
"subject_id"라는 컬럼이 있는 경우,
양쪽에 같은 값이 있는 경우에만 합쳐져서 나옴(하나라도 없으면 버림)
  subject_id	test_score	first_name	last_name
0	4	61	Billy	Bonder
1	5	16	Brian	Black
2	7	14	Bryce	Brice
3	8	15	Betty	Btisan
"""
##########################################################################
# (left df, right df, )
# 두 dataframe의 column 이름이 다를때 이름 지정해서 합쳐줄 수 있음
pd.merge(df_a, df_b, left_on="subject_id", right_on="subject_id")

# 규칙있음
pd.merge(df_a, df_b, on="subject_id", how="left") # left join # left 쪽의 데이터만 보여주고 없으면 NaN
pd.merge(df_a, df_b, on="subject_id", how="right") # right join
pd.merge(df_a, df_b, on="subject_id", how="outer") # full(outer) join # 양쪽을 다 살림, 빈곳은 NaN # full : 일단 같은거 붙이고, 없는건 정리하여 붙임
pd.merge(df_a, df_b, on="subject_id", how="inner") # inner join (default) 양쪽 다 같은 값이 있을때

"""
how="left"인 경우,
왼쪽값을 기준으로 모두 출력
왼쪽에만 있고 오른쪽에 없는 값은 NaN을 넣어 출력
오른쪽에만 있고 왼쪽에 없는 값은 출력하지 않음
"""
##########################################################################
pd.merge(df_a, df_b, right_index=True, left_index=True)
# 인덱스 값을 기준으로 붙임
# 인덱스 값은 지정하지 않았을 경우에 숫자임
# 두 그룹이 중복되는 경우 존재 -> 그럴때 _x _y 이렇게 붙어서 칼럼으로 들어옴
# last_name_x  last_name_y
concat
- 같은 형태의 데이터를 붙이는 연산작업
- 기본 명제: a와 b가 같은 컬럼을 가지고 있을 때
axis=1: 옆으로 붙음1 2 3 4 5 6 7 8 9 10 11 12 13 14 15 16 17 18 19 20 21
raw_data = { "subject_id": ["1", "2", "3", "4", "5"], "first_name": ["Alex", "Amy", "Allen", "Alice", "Ayoung"], "last_name": ["Anderson", "Ackerman", "Ali", "Aoni", "Atiches"], } df_a = pd.DataFrame(raw_data, columns=["subject_id", "first_name", "last_name"]) raw_data = { "subject_id": ["4", "5", "6", "7", "8"], "first_name": ["Billy", "Brian", "Bran", "Bryce", "Betty"], "last_name": ["Bonder", "Black", "Balwner", "Brice", "Btisan"], } df_b = pd.DataFrame(raw_data, columns=["subject_id", "first_name", "last_name"]) df_new = pd.concat([df_a, df_b]) df_new.reset_index(drop=True) df_a.append(df_b) # concat과 같은 역할 df_new = pd.concat([df_a, df_b], axis=1) # 옆으로 붙음 df_new.reset_index()
Persistence
- 데이터프레임 IO: 대표적으로 DB 사용하는 것
- sqlite: file 형태로 데이터베이스
- Database connection
- Data loading시 db connection 기능을 제공함
- 엑셀과 피클 형태로 write하고 싶을 경우
conda install openpyxlconda install XlsxWriter
1
2
3
4
5
6
7
8
9
10
11
12
13
14
15
16
17
18
19
20
21
22
23
24
25
26
# Database 연결코드
import sqlite3  # pymysql <- 설치

# 데이터베이스 로드
conn = sqlite3.connect("./data/flights.db")
cur = conn.cursor()
cur.execute("select * from airlines limit 5;")
results = cur.fetchall()
# results 튜플형태 데이터 들어옴

# 데이터 로드
df_airplines = pd.read_sql_query("select * from airlines;", conn)
df_airplines
# db연결 conn을 사용하여 dataframe 생성

df_airports = pd.read_sql_query("select * from airports;", conn)
df_routes = pd.read_sql_query("select * from routes;", conn)

# 엑셀과 피클형태로 저장할 수 있음
writer = pd.ExcelWriter("./data/df_routes.xlsx", engine="xlsxwriter")
df_routes.to_excel(writer, sheet_name="Sheet1")

df_routes.to_pickle("./data/df_routes.pickle")

df_routes_pickle = pd.read_pickle("./data/df_routes.pickle")
df_routes_pickle.head()
- XLS persistence
- Dataframe의 엑셀 추출 코드
- Xls 엔진으로 openpyxls 또는 XlsxWrite 사용
- Pickle persistence
- 가장 일반적인 python 파일 persistence
- to_pickle, read_pickle 함수 사용
case study
- ppt 참고(p22~)
.plot(): 시각화 (matplotlib)df_phone.groupby(["month", "item"])[duration].count().unstack().plot().groupby("month", "as_index=False): month로 그룹화 하지만 인덱스로 삼지않음- operation 넣을 떄 dict type으로 다채롭게 넣을 수 있음
.droplevel(level=0)grouped.rename(column={"min":"min_dur", "max":"max_dur", ...})grouped.add_prefix("duration_"): 컬럼 앞에 덧붙여서 출력해줌
join, concat case
1
2
3
4
5
6
7
8
9
10
11
12
13
14
15
16
17
18
19
import os

files = [file_name for file_name in os.listdir("./data") if file_name.endswith("xlsx")]
files.remove("excel-comp-data.xlsx")
files.remove("df_routes.xlsx")

files = sorted(files)

# df_list = [pd.read_excel("data/" + df_filename) for df_filename in files]
df_list = [pd.read_excel(os.path.join("data", df_filename)) for df_filename in files] # 읽어서 리스트에 저장
status = df_list[0]
sales = pd.concat(df_list[1:])

merge_df = pd.merge(status, sales, how="inner", on="account number")
merge_df.groupby(["status", "name_x"])["quantity", "ext price"].sum().reset_index().sort_values(by=["status", "quantity"], ascending=False)
# status 기준 할거면 how="left"

# how="left" 쓸거면
# del merge_df["name_x"]
